desc.plotting.poincare_plot
- desc.plotting.poincare_plot(field, R0, Z0, ntransit=100, phi=None, NFP=None, grid=None, ax=None, return_data=False, **kwargs)Source
Poincare plot of field lines from external magnetic field.
- Parameters:
field (MagneticField) – External field, coilset, current potential etc to plot from.
R0 (array-like) – Starting points at phi=0 for field line tracing.
Z0 (array-like) – Starting points at phi=0 for field line tracing.
ntransit (int) – Number of transits to trace field lines for.
phi (float, int or array-like or None) – Values of phi to plot section at. If an integer, plot that many contours linearly spaced in (0,2pi). Default is 6.
NFP (int, optional) – Number of field periods. By default attempts to infer from
field, otherwise uses NFP=1.grid (Grid, optional) – Grid used to discretize
field.ax (matplotlib AxesSubplot, optional) – Axis to plot on.
return_data (bool) – If True, return the data plotted as well as fig,ax
**kwargs (dict, optional) –
Specify properties of the figure, axis, and plot appearance e.g.:
plot_X(figsize=(4,6),)
Valid keyword arguments are:
figsize: tuple of length 2, the size of the figure (to be passed to matplotlib)color: str or tuple, color to use for field lines.marker: str, markerstyle to use for the plotted pointssize: float, markersize to use for the plotted pointstitle_fontsize: integer, font size of the titlexlabel_fontsize: float, fontsize of the xlabelylabel_fontsize: float, fontsize of the ylabel
Additionally, any other keyword arguments will be passed on to
desc.magnetic_fields.field_line_integrate(exceptreturn_aux).
- Returns:
fig (matplotlib.figure.Figure) – Figure being plotted to.
ax (matplotlib.axes.Axes or ndarray of Axes) – Axes being plotted to.
plot_data (dict) – Dictionary of the data plotted, only returned if
return_data=True
Examples
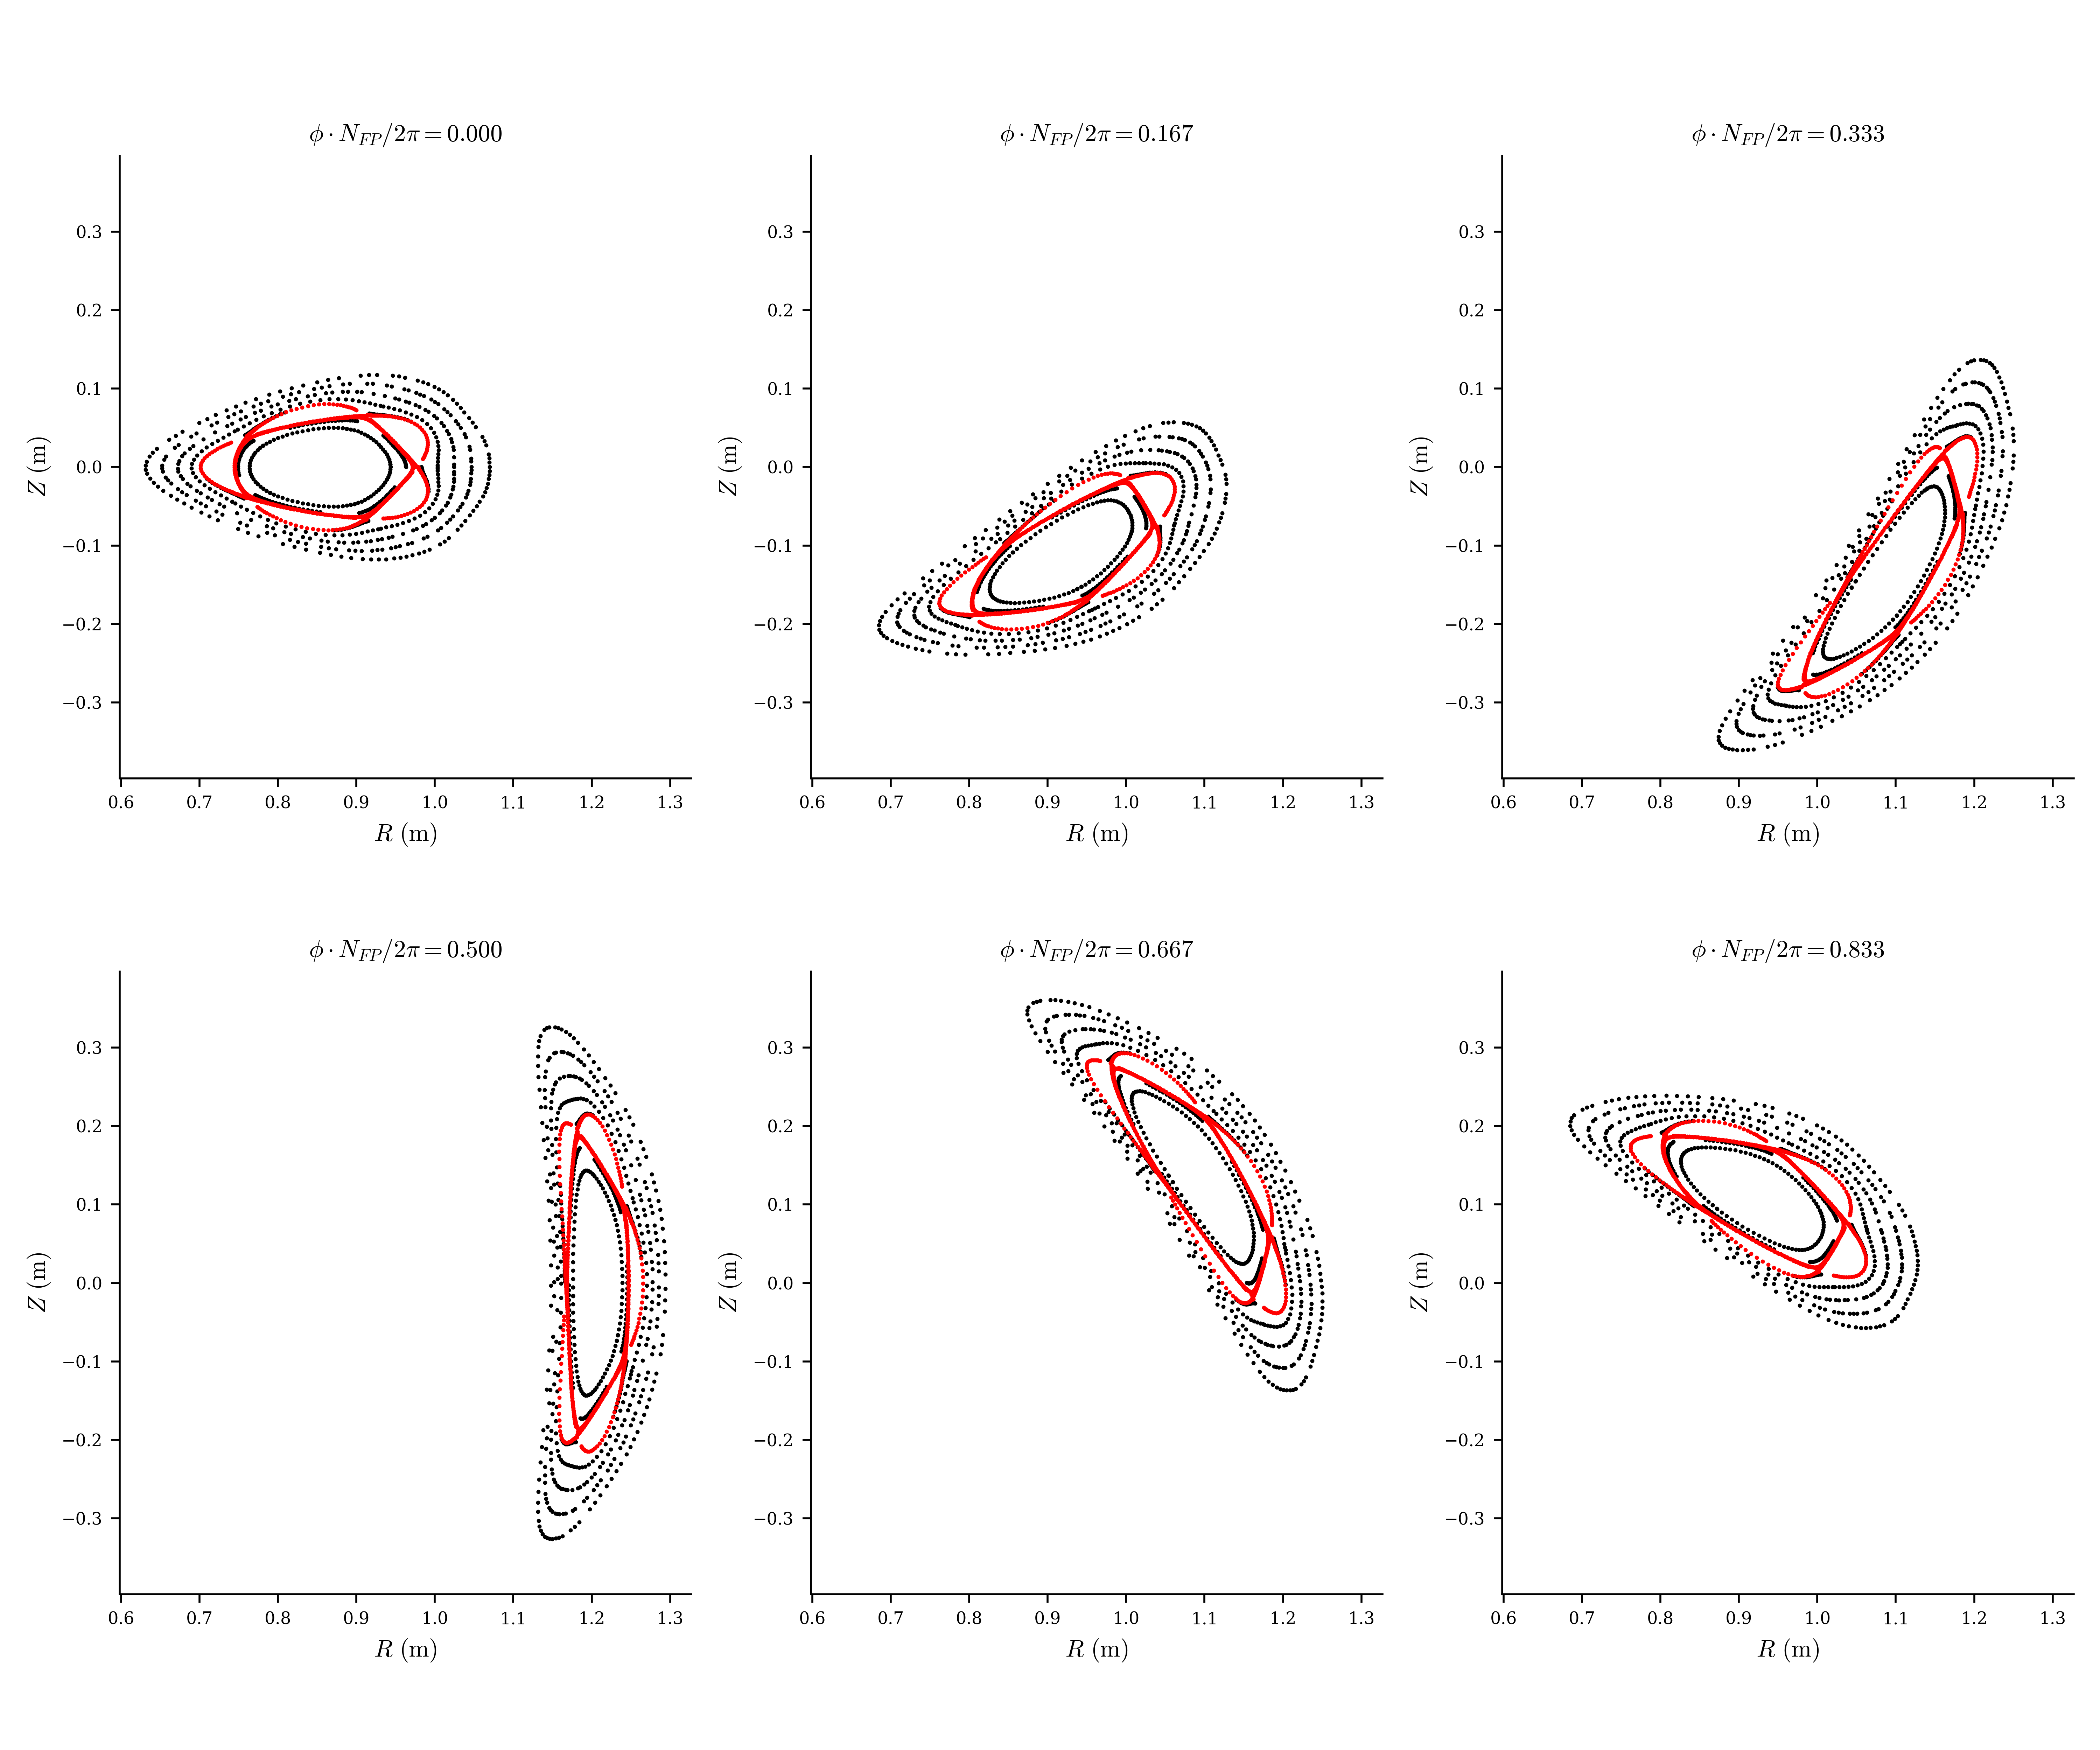
from desc.plotting import poincare_plot
grid_trace = LinearGrid(rho=np.linspace(0.4, 0.9, 7))
r0 = eq.compute("R", grid=grid_trace)["R"]
z0 = eq.compute("Z", grid=grid_trace)["Z"]
fig, ax = desc.plotting.poincare_plot(
    field,
    r0,
    z0,
    NFP=eq.NFP,
    color="k",
    size=0.5,
    ntransit=100
)
grid_trace2 = LinearGrid(rho=np.linspace(0.52, 0.55, 4))
r0 = eq.compute("R", grid=grid_trace2)["R"]
z0 = eq.compute("Z", grid=grid_trace2)["Z"]
fig, ax = desc.plotting.poincare_plot(
    field, r0, z0, NFP=eq.NFP, ax=ax, color="r", size=0.5, ntransit=250
)