desc.plotting.plot_boundaries
- desc.plotting.plot_boundaries(eqs, labels=None, phi=None, plot_axis=True, ax=None, return_data=False, **kwargs)Source
Plot stellarator boundaries at multiple toroidal coordinates.
NOTE: If attempting to plot objects with differing NFP, phi must be given explicitly.
- Parameters:
eqs (array-like of Equilibrium, Surface or EquilibriaFamily) – Equilibria to plot.
labels (array-like) – Array the same length as eqs of labels to apply to each equilibrium.
phi (float, int or array-like or None) – Values of phi to plot boundary surface at. If an integer, plot that many contours linearly spaced in [0,2pi). Default is 1 contour for axisymmetric equilibria or 4 for non-axisymmetry.
plot_axis (bool) – Whether to plot the magnetic axis locations. Default is True.
ax (matplotlib AxesSubplot, optional) – Axis to plot on.
return_data (bool) – If True, return the data plotted as well as fig,ax
**kwargs (dict, optional) –
Specify properties of the figure, axis, and plot appearance e.g.:
plot_X(figsize=(4,6),label="your_label")
Valid keyword arguments are:
figsize: tuple of length 2, the size of the figure (to be passed to matplotlib)xlabel_fontsize: float, fontsize of the x labelylabel_fontsize: float, fontsize of the y labellegend: bool, whether to display legend or notlegend_kw: dict, any keyword arguments to be passed to ax.legend()cmap: colormap to use for plotting, discretized into len(eqs) colorscolor: list of colors to use for each Equilibriumls: list of str, line styles to use for each Equilibriumlw: list of floats, line widths to use for each Equilibriummarker: str, marker style to use for the axis plotted pointssize: float, marker size to use for the axis plotted points
- Returns:
fig (matplotlib.figure.Figure) – Figure being plotted to.
ax (matplotlib.axes.Axes or ndarray of Axes) – Axes being plotted to.
plot_data (dict) – Dictionary of the data plotted, only returned if
return_data=True
Examples
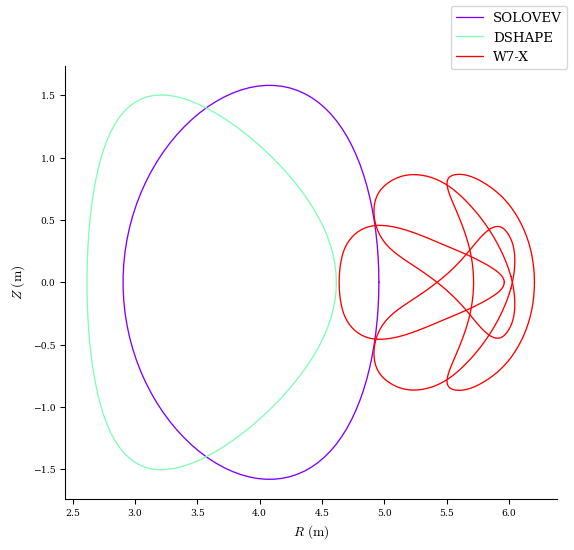
from desc.plotting import plot_boundaries
fig, ax = plot_boundaries((eq1, eq2, eq3))