desc.plotting.plot_2d
- desc.plotting.plot_2d(eq, name, grid=None, log=False, normalize=None, ax=None, return_data=False, compute_kwargs=None, **kwargs)Source
Plot 2D cross-sections.
- Parameters:
eq (Equilibrium, Surface) – Object from which to plot.
name (str) – Name of variable to plot.
grid (Grid, optional) – Grid of coordinates to plot at.
log (bool, optional) – Whether to use a log scale.
normalize (str, optional) – Name of the variable to normalize
nameby. Default is None.ax (matplotlib AxesSubplot, optional) – Axis to plot on.
return_data (bool) – If True, return the data plotted as well as fig,ax
compute_kwargs (dict, optional) – Additional keyword arguments to pass to
eq.compute.**kwargs (dict, optional) –
Specify properties of the figure, axis, and plot appearance e.g.:
plot_X(figsize=(4,6),cmap="plasma")
Valid keyword arguments are:
figsize: tuple of length 2, the size of the figure (to be passed to matplotlib)component: str, one of [None, ‘R’, ‘phi’, ‘Z’], For vector variables, which element to plot. Default is the norm of the vector.title_fontsize: integer, font size of the titlexlabel_fontsize: float, fontsize of the xlabelylabel_fontsize: float, fontsize of the ylabelcmap: str, matplotlib colormap scheme to use, passed to ax.contourflevels: int or array-like, passed to contourf. Ifname="|F|_normalized"andlog=True, default isnp.logspace(-6, 0, 7). Otherwise the default (None) uses the min/max values of the data.field: MagneticField, a magnetic field with which to calculate Bn on the surface, must be provided if Bn is entered as the variable to plot.field_grid: MagneticField, a Grid to pass to the field as a source grid from which to calculate Bn, by default None.filled: bool, whether to fill contours or not i.e. whether to use contourf or contour
- Returns:
fig (matplotlib.figure.Figure) – Figure being plotted to.
ax (matplotlib.axes.Axes or ndarray of Axes) – Axes being plotted to.
plot_data (dict) – Dictionary of the data plotted, only returned if
return_data=True
Examples
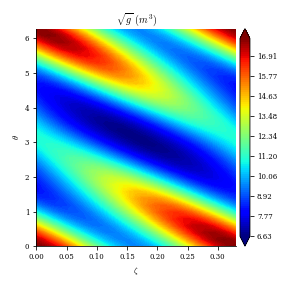
from desc.plotting import plot_2d
plot_2d(eq, 'sqrt(g)')