desc.plotting.plot_gammac
- desc.plotting.plot_gammac(eq, rho=None, alphas=None, num_pitch=None, ax=None, return_data=False, **kwargs)Source
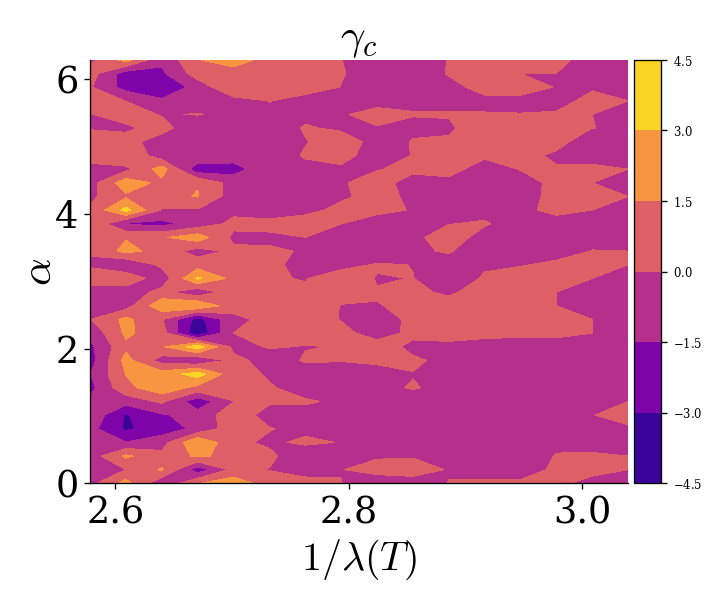
Plot the energetic proxy metric γ_c for a single flux surface.
- Parameters:
eq (object) – Equilibrium object containing magnetic field information
rho (float, optional) – Flux surface radius. If float, plots single surface. Default: 0.5
alphas (array_like, optional) – Fieldline label values (toroidal angle). Default: np.linspace(0, 2π, 25, endpoint=True)
num_pitch (int, optional) – Number of pitch angle values for bounce integral calculation. Default: 28
ax (matplotlib AxesSubplot, optional) – Axis to plot on.
return_data (bool) – If True, return the data plotted as well as fig,ax
**kwargs (dict, optional) –
Specify properties of the figure, axis, and plot appearance e.g.:
plot_X(figsize=(4,6),label="your_label")
Valid keyword arguments are:
figsize: tuple of length 2, the size of the figure (to be passed to matplotlib)cmap: str, matplotlib colormap scheme to use, passed to ax.contourfX,Y,Y_B,num_quad,num_well: intnum_transit: int
hyperparameters for bounce integration. See
Bounce2D
- Returns:
fig (matplotlib.figure.Figure) – The figure object containing the plot
ax (matplotlib.axes.Axes) – The axes object for further customization
plot_data (dict) – Dictionary of the data plotted, only returned if
return_data=True
Examples
from desc.plotting import plot_gammac
fig, ax = plot_gammac(eq, rho=0.5)