desc.plotting.plot_fsa
- desc.plotting.plot_fsa(eq, name, with_sqrt_g=True, log=False, rho=20, M=None, N=None, normalize=None, ax=None, return_data=False, grid=None, compute_kwargs=None, **kwargs)Source
Plot flux surface averages of quantities.
- Parameters:
eq (Equilibrium) – Object from which to plot.
name (str) – Name of variable to plot.
with_sqrt_g (bool, optional) –
Whether to weight the surface average with sqrt(g), the 3-D Jacobian determinant of flux coordinate system. Default is True.
The weighted surface average is also known as a flux surface average. The unweighted surface average is also known as a theta average.
Note that this boolean has no effect for quantities which are defined as surface functions because averaging such functions is the identity operation.
log (bool, optional) – Whether to use a log scale.
rho (int or array-like) – Values of rho to plot contours of. If an integer, plot that many contours linearly spaced in (0,1).
M (int, optional) – Poloidal grid resolution. Default is eq.M_grid.
N (int, optional) – Toroidal grid resolution. Default is eq.N_grid.
normalize (str, optional) – Name of the variable to normalize
nameby. Default is None.ax (matplotlib AxesSubplot, optional) – Axis to plot on.
return_data (bool) – if True, return the data plotted as well as fig,ax
grid (_Grid) – Grid to compute name on. If provided, the parameters
rho,M, andNare ignored.compute_kwargs (dict, optional) – Additional keyword arguments to pass to
eq.compute.**kwargs (dict, optional) –
Specify properties of the figure, axis, and plot appearance e.g.:
plot_X(figsize=(4,6),label="your_label")
Valid keyword arguments are:
figsize: tuple of length 2, the size of the figure (to be passed to matplotlib)component: str, one of [None, ‘R’, ‘phi’, ‘Z’], For vector variables, which element to plot. Default is the norm of the vector.label: str, label of the plotted line (e.g. to be shown with ax.legend())xlabel_fontsize: float, fontsize of the xlabelylabel_fontsize: float, fontsize of the ylabelcolor: str or tuple, color to use for plot linels: str, linestyle to use for plot linelw: float, linewidth to use for plot line
- Returns:
fig (matplotlib.figure.Figure) – Figure being plotted to.
ax (matplotlib.axes.Axes or ndarray of Axes) – Axes being plotted to.
plot_data (dict) – Dictionary of the data plotted, only returned if
return_data=True
Examples
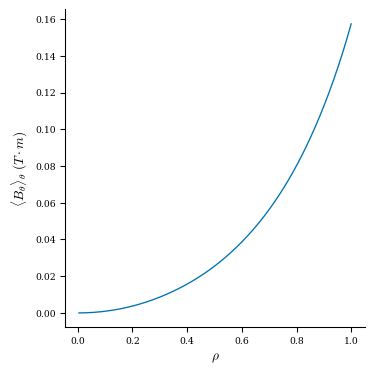
from desc.plotting import plot_fsa
fig, ax = plot_fsa(eq, "B_theta", with_sqrt_g=False)