desc.plotting.plot_basis
- desc.plotting.plot_basis(basis, derivative=array([0, 0, 0]), return_data=False, **kwargs)Source
Plot basis functions.
- Currently supported basis classes are:
PowerSeries
FourierSeries
ChebyshevPolynomial
DoubleFourierSeries
ZernikePolynomial
FourierZernikeBasis (only 2D in rho and theta)
ChebyshevDoubleFourierBasis (only 2D in rho and theta)
- Parameters:
basis (Basis) – basis to plot
derivative ((1,3), optional) – Order of derivatives to compute in (rho,theta,zeta). Default is [0,0,0] (no derivative).
return_data (bool) – If True, return the data plotted as well as fig,ax
**kwargs (dict, optional) –
Specify properties of the figure, axis, and plot appearance e.g.:
plot_X(figsize=(4,6),cmap="plasma")
Valid keyword arguments are:
figsize: tuple of length 2, the size of the figure (to be passed to matplotlib)cmap: str, matplotlib colormap scheme to use, passed to ax.contourftitle_fontsize: integer, font size of the title
- Returns:
fig (matplotlib.figure.Figure) – Figure being plotted to.
ax (matplotlib.axes.Axes, ndarray of axes, or dict of axes) – Axes being plotted to. A single axis is used for 1d basis functions, 2d or 3d bases return an ndarray or dict of axes. return_data : bool if True, return the data plotted as well as fig,ax
plot_data (dict) – Dictionary of the data plotted, only returned if
return_data=True
Examples
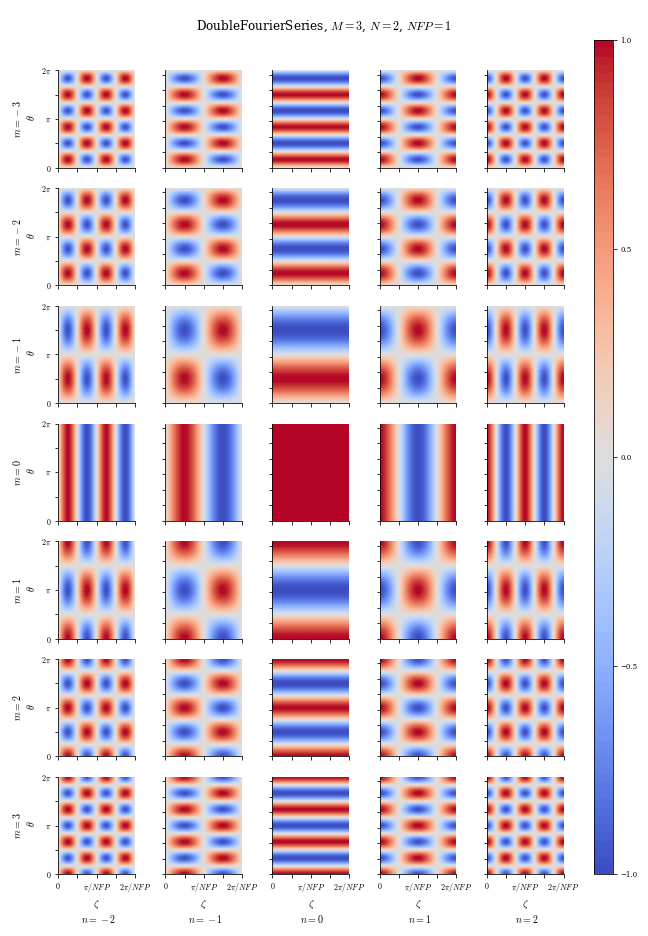
from desc.plotting import plot_basis
from desc.basis import DoubleFourierSeries
basis = DoubleFourierSeries(M=3, N=2)
fig, ax = plot_basis(basis)